Introduction to SAP Fiori Analytical Apps
SAP Fiori Apps are a group of accumulated cards of Apps, which represents the new user experience that assures that employees’ and managers have consistent, coherent, simple, and intuitive user experience.
The analytical apps provided highlights back orders, demand fulfilment, sales order fulfilment and delivery performance in the sales process.
In this blog, we would look into the SAP Fiori analytical apps and its various apps.
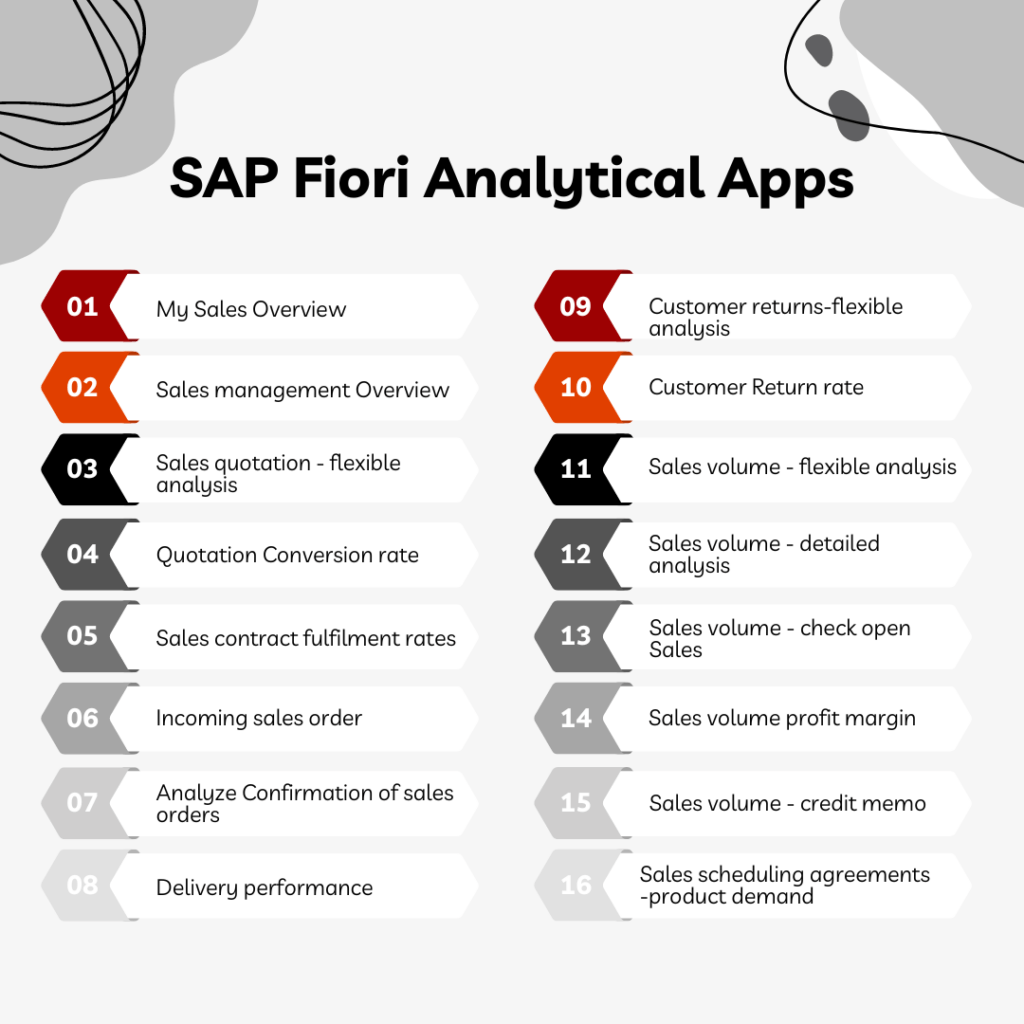
Now, let’s discuss each of the SAP Fiori analytical apps in detail
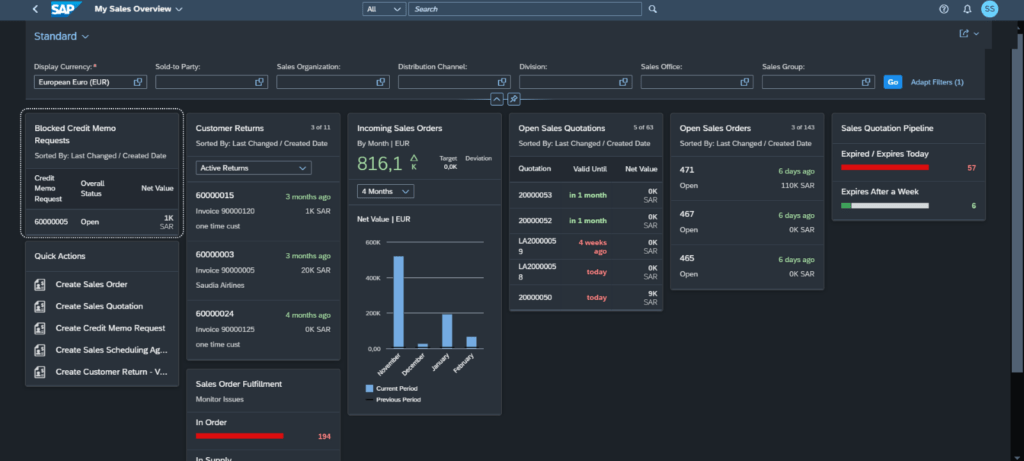
1. My sales Overview
This app allows you to display and create sales data using actionable cards that are grouped together in a dashboard format.
|
APP ID |
DESCRIPTION |
| F2200 |
My Sales Overview |
The cards in my sales overview app provides the information on sales data, including:
- Open sales Quotations and Sales orders
- Blocked Credit memo requests
- Customer Returns
- Sales Order fulfilment
You can filter out the data by sold to party, sales organization, distribution channel and division.
1.1 Open Sales quotations and sales orders
This card navigates to the app: Manage sales quotations and Manage sales orders shows list of quotations and sales orders, quotation valid date, requested delivery date, net value and so on.
The data can filter according to sales quotation/order, sold to party, customer reference and so on.
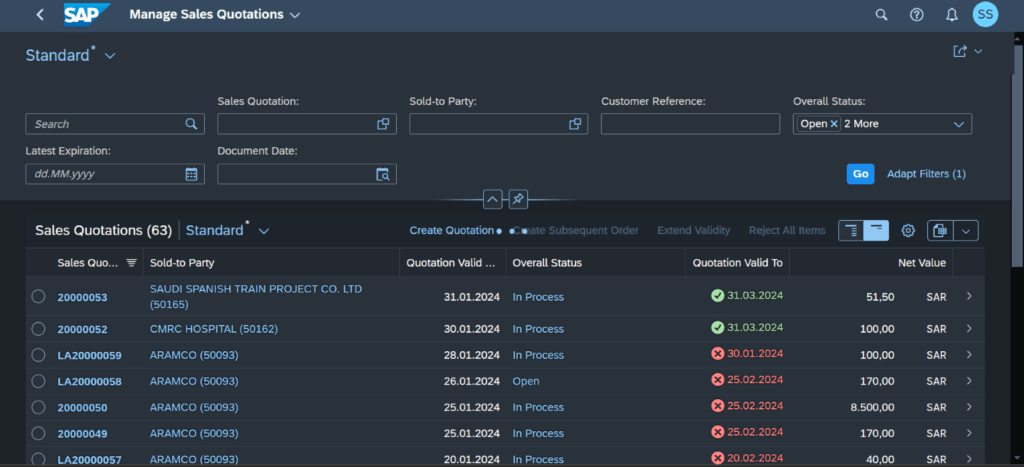
1.1.1 Open Sales Quotations:
The data can be filtered out according to sales quotation, sold to party, customer reference, latest expiration and so on.
From the list, you can execute different actions, for example, you can extend the validity of a quotation. You can also navigate to related applications, for example, to display quotation details.
You can also navigate to the below app:
|
APP ID |
DESCRIPTION |
|
F1852 |
Manage Sales quotation |
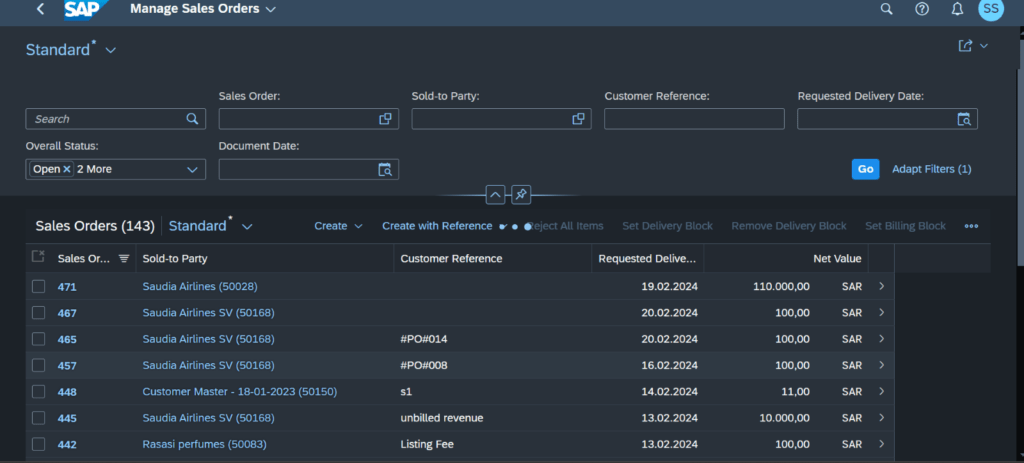
1.1.2 Open Sales Orders:
The data can be filtered out according to sales order, sold to party, customer reference, requested delivery date and so on.
You can also navigate to related apps, for example, to display sales order details, or you can display the process flow.
You can also navigate to the below app:
| APP ID |
DESCRIPTION |
| F1873 |
Manage Sales Orders |
1.2 Blocked Credit Memo Requests
This card represents the app manage credit memo requests, here you can create, display, and edit credit memo requests.
You can also track document progress by monitoring various statuses, blocks, and the process flow.
You can filter out the data by entering credit memo request number, sold to party, customer reference and so on.
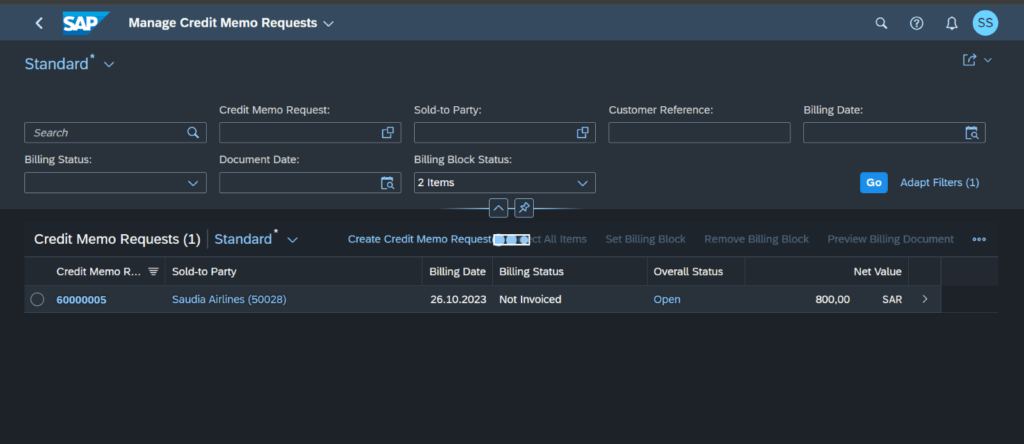
You can set or remove billing blocks from selected credit memo requests.
You can navigate through the below app.
| APP ID |
DESCRIPTION |
|
F1989A |
Manage credit memo requests |
1.3 Customer Returns
With this app, you can initiate customer returns by creating returns orders.
The data can be filtered according to return order, sold to party, customer reference and so on.
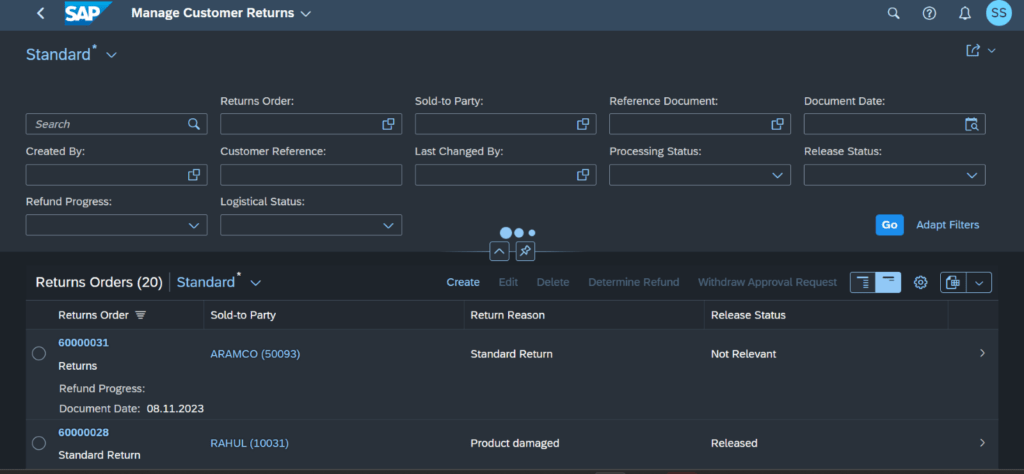
You can track customer return progress by monitoring various statuses and by displaying the process flow.
You can navigate through the below app.
|
APP ID |
DESCRIPTION |
| F1708 |
Manage Customer Returns |
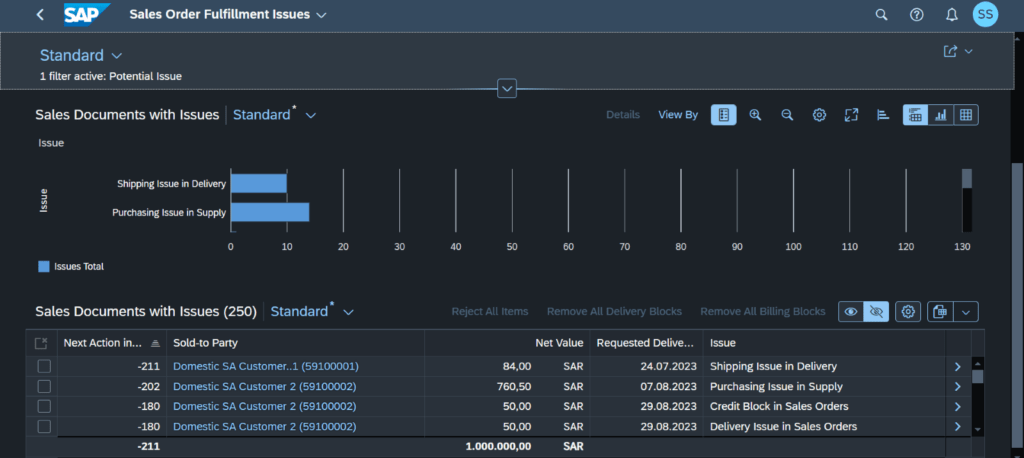
1.4 Sales order fulfilment
This app allows you to analyze and resolve issues that impede sales orders from being fulfilled.
You can also analyze sales orders in critical stages, efficiently address issues to ensure that sales orders in critical stages are fulfilled as quickly as possible.
The app allows you to navigate to track sales order(F2577) details for further details and resolve the issues.
2. Sales Management Overview:
This App allows us to view the graphical overview of various sales data on analytical cards and further you can analyze the data by navigating to related analytical apps from the cards.
| APP ID |
DESCRIPTION |
| F2601 |
Sales Management Overview |
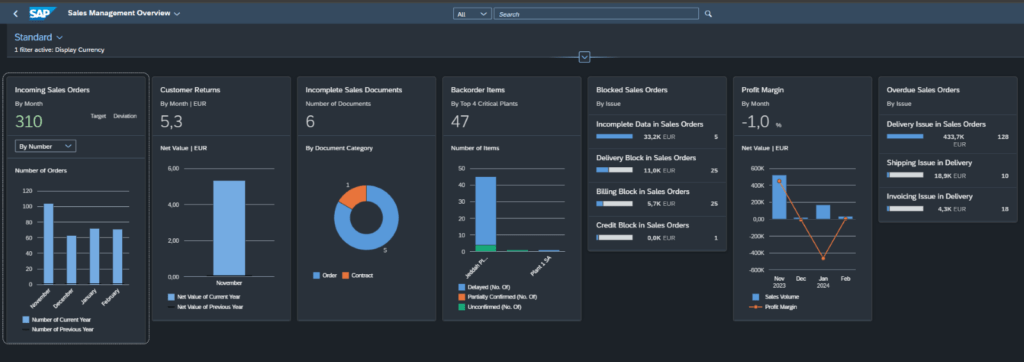
Features
- Each sales topic is represented by a card. On the cards, you can view relevant sales KPIs.
- All the Sales data is visualized in charts and lists.
- You can filter results by various criteria, such as sold-to party, sales organization, distribution channel.
- You can specify a preferred currency for displaying the results.
- You can navigate to related apps to drill down into the data.
The app provides the following Cards:
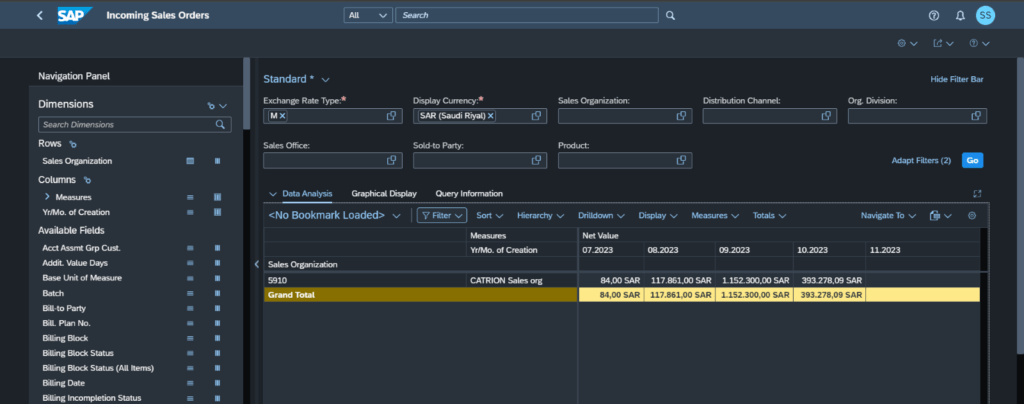
2.1 Incoming Sales Orders
This card Displays the last four months and let you compare them to the same period in the previous year.
It Indicates the total net value or the number of sales order items that are relevant for billing or delivery.
You can drill down to view detailed information for the selected sales organizations, products, sold-to parties, sales document types, and so on.
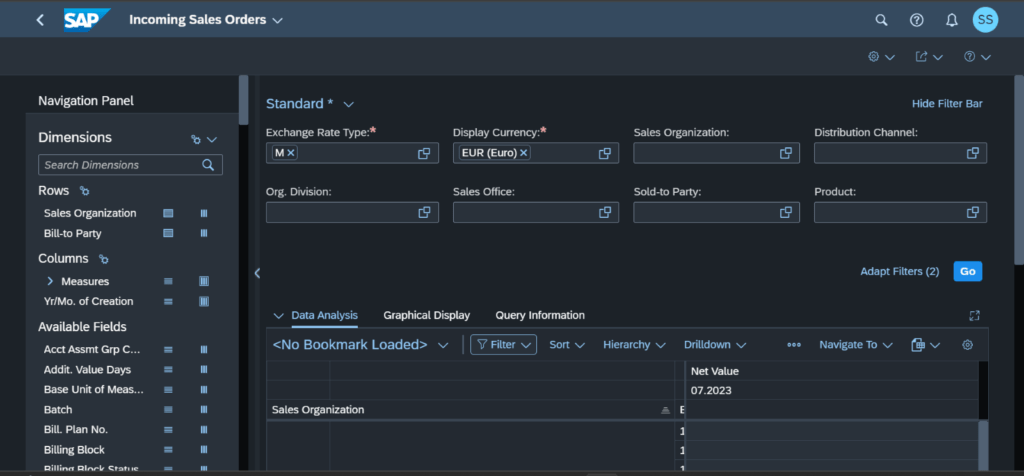
You can either open through the sales management overview app or navigate through the below app.
| APP ID |
DESCRIPTION |
| F1249 |
Incoming Sales Orders |
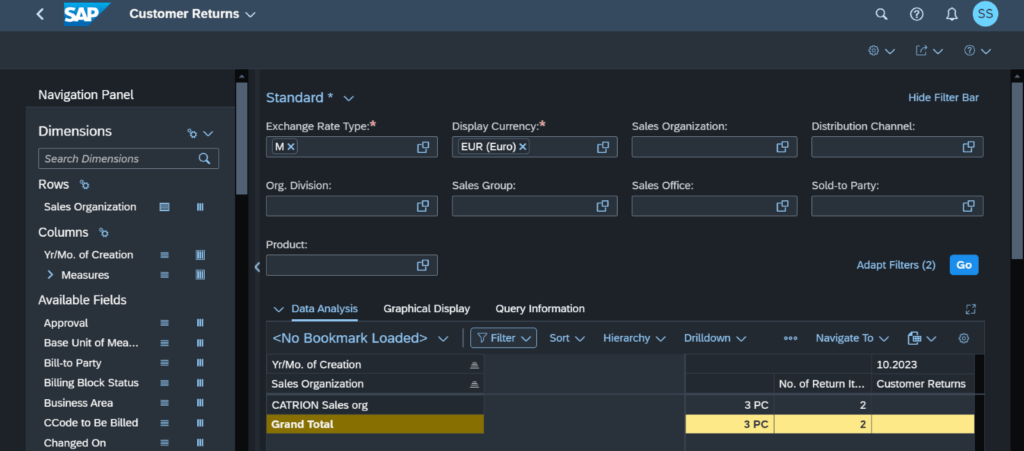
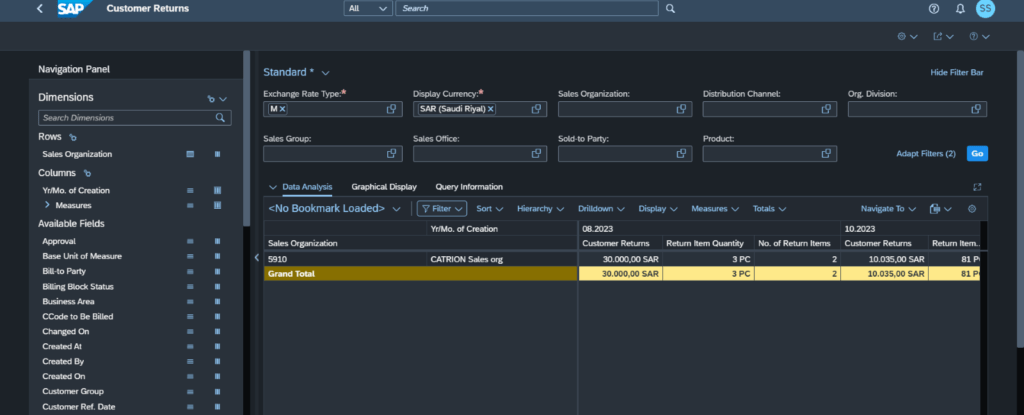
2.2 Customer Returns
In this card, it Indicates the total net value of customer return items that are relevant for billing or delivery.
Customer return related KPI are:
- Customer returns->contains the Net amount of customer return items that are relevant for billing or delivery.
- Return Item Quantity-> Quantity of customer return items that are relevant for delivery or billing.
- No. of return items-> Number of customer return items that are relevant for delivery or billing.
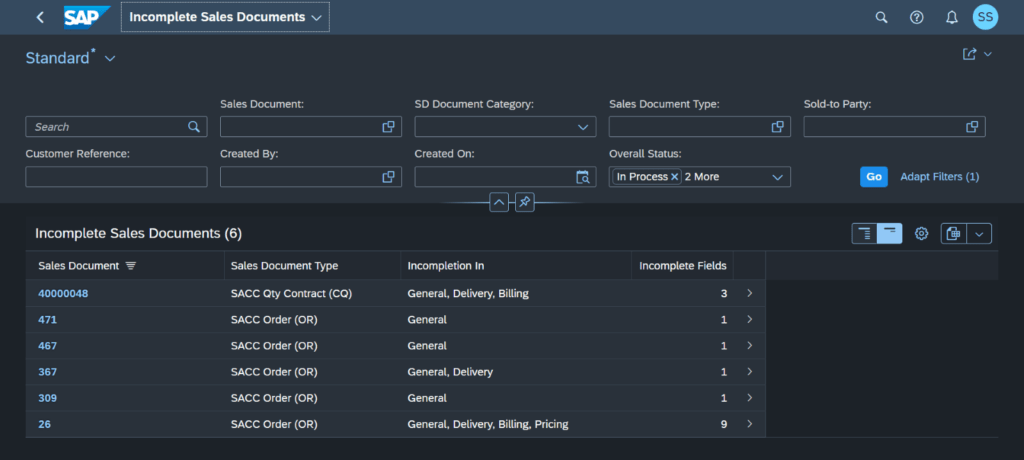
2.3. Incomplete Sales Documents
This card displays the total number of incomplete sales documents.
You can navigate through the below app.
| APP ID |
DESCRIPTION |
| F2430 |
List Incomplete Sales Documents |
You can search for incomplete sales documents according to your filter criteria (Sales document, sales document type, sold to party, customer reference and so on) and display them in a list.
From the list, you can navigate to related features to display and complete the missing data of the selected sales document.
Navigate to an incomplete sales document’s incompletion log, either to display or to change data, by selecting a row in the list.
2.4. Backorder Items
With this tile, you can identify backlogs regarding quantities and delivery dates that customers have. This allows you to see where you can increase future sales volume and customer satisfaction.
This app Displays the total number of backorders items.
Graphical View:
You can extend to various dimensions such as product, sold to party etc and change to different chart views
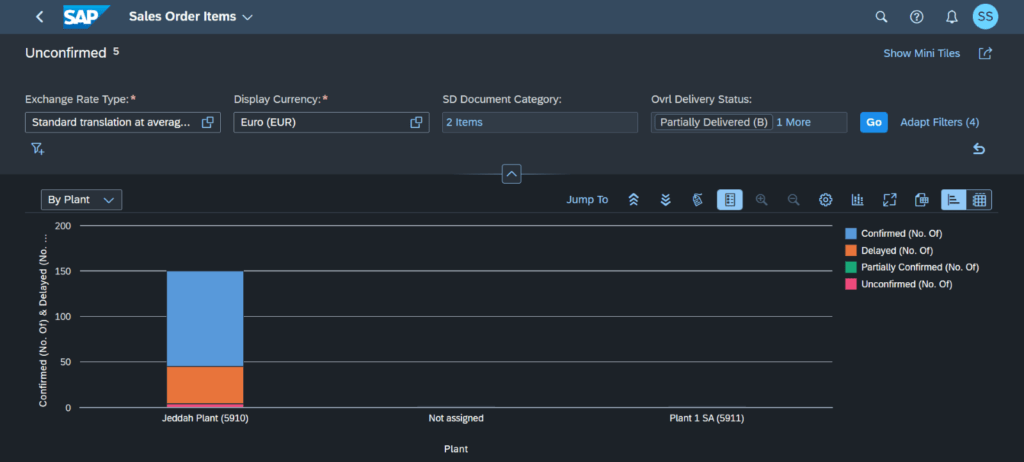
Table View:
2.5. Profit Margin
This app Indicates the difference between sales volume and costs.
We can gain insights into the number of credit memos resulting from returns and complaints, and cancellations, that is, invoices that have been cancelled due to internal errors in your company. From here, you can investigate the reasons for returns and complaints.
|
APP ID |
DESCRIPTION |
| F2271 |
Sales Volume-Profit Margin |
This app helps to View the monthly sales volume and profit margin amount as a graphic or a table.
Graphical View:
You can filter the items according to various criteria, such as year/month, sales organization, sold-to party, sales document.
You can also Navigate to related apps via the mini tiles at the top of the screen.
X axis represents the sales volume and profit margins while the Y axis shows the month/year of billing and you can click drill down for various dimensions such as material, sold to party, customer, billing category.
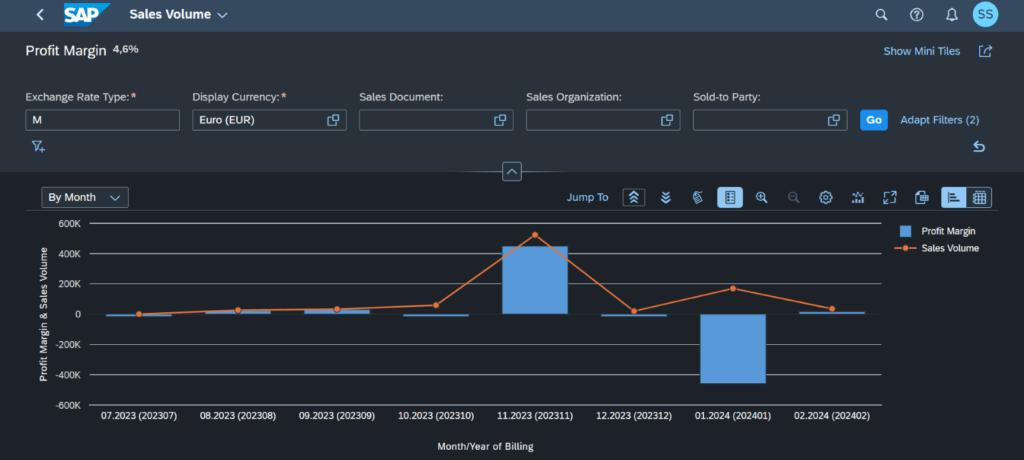
You can change the charts types for different graphical view and if you want to export the data, you can click on export to spreadsheet icon.
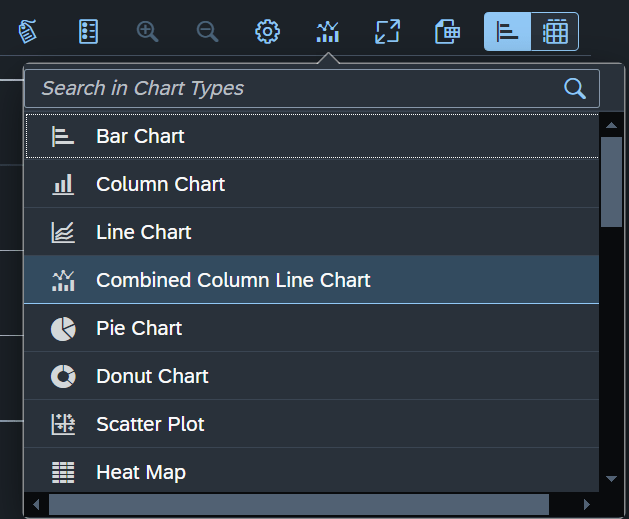
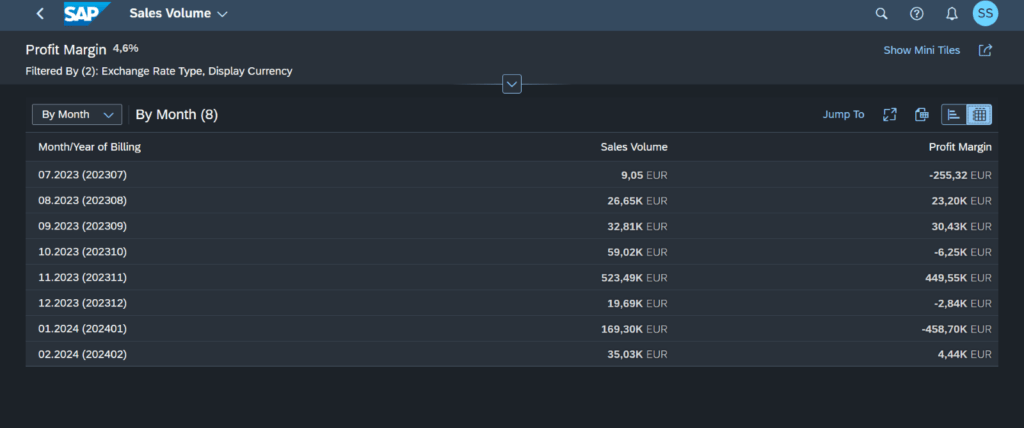
Table View:
2.6. Blocked Sales Orders
This card displays the total net value and the number of blocked sales orders by issue type.
You can navigate to app Sales order fulfillment – Analyze Issues which is deprecated, instead you can navigate through the below app
| APP ID |
DESCRIPTION |
|
F0029A |
Sales Order Fulfillment issues (version 2) |
2.1.1 Sales order Fulfillment issues
This app allows you to analyze and resolve issues that impede sales orders from being fulfilled.
You can also analyze sales orders in critical stages, efficiently address issues to ensure that sales orders in critical stages are fulfilled as quickly as possible.
The app allows you to navigate to track sales order details for further details and resolve the issues.
2.7. Overdue Sales Orders
This app displays the total net value and the number of overdue sales orders by issue type.
You can navigate to app Sales order fulfillment – Analyze Issues which is deprecated, instead you can navigate through the below app.
|
APP ID |
DESCRIPTION |
| F0029A |
Sales Order Fulfillment issues (version 2) |
3. Sales Quotation – flexible Analysis and Quotation Conversion rates
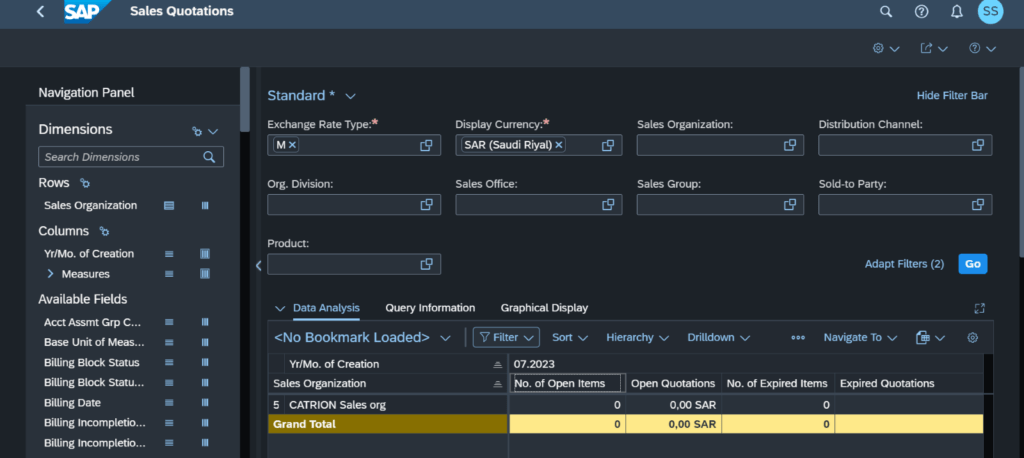
3.1 Sales Quotation – flexible Analysis
With this app sales quotation – flexible analysis, you can analyze sales quotations based on flexible combinations of dimensions.
You can get a monthly rolling trend of your quotations and see to what extent they are being referenced by sales orders.
You can quickly identify the critical quotations that are close to expiring, have expired, or are rejected.
Navigate through the below app
|
APP ID |
DESCRIPTION |
| W0140 |
Sales Quotations |
This quotation related KPI’s are:
No. of open items, Open quotations, No. of expired items, No. of rejected items and so on.
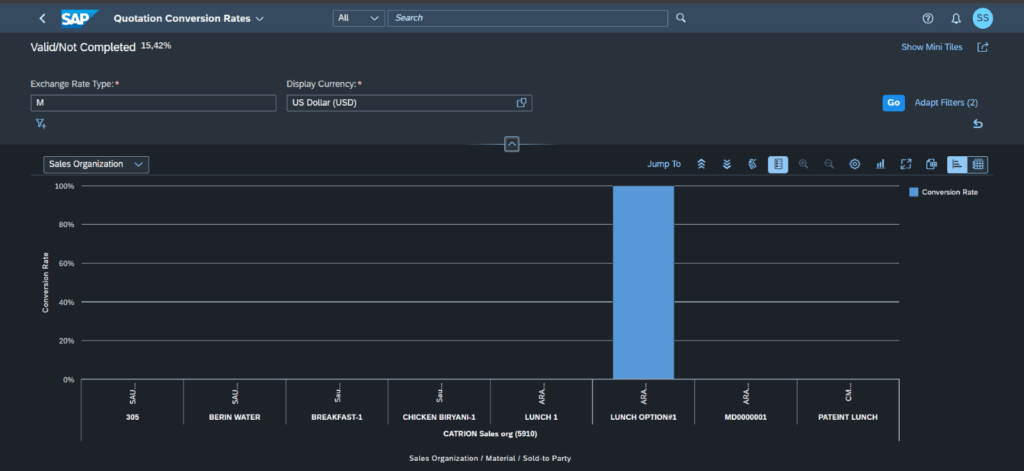
3.1 Quotation Conversion Rates
This analytical app displays quotation conversion rate which indicates the percentage of net values converted from quotations into sales orders.
You can use quotation conversion rate to track to what extent your quotations are being converted to sales orders before expiring.
Navigate through the below app.
| APP ID |
DESCRIPTION |
|
F1904 |
Quotations Conversion Rates |
Filter out the data based on sales organization, customer, product, and drill down to various dimensions such as material, sales quotation, sold to party and so on.
You can either view it in graphical view or table view and change to different chart type according to your convenience.
4. Sales contract Fulfillment Rates
This analytical app which indicates the percentage of the target value that has been released in a sales contract.
You can use sales contract fulfilment rate to analyze how well the contracts in your responsible sales area are being fulfilled.
You can quickly identify contracts that need to be renewed soon, as well as contracts that are not being fulfilled as expected.
For this app, you can navigate through the below app ID
| APP ID |
DESCRIPTION |
| F1905 |
Sales Contract Fulfillment rates |
You can either view it in graphical or table view.
Graphical View:
In the app, you can drill down to analyze sales contract fulfilment rates by different dimensions, such as sales organization, customer, product, and employee responsible.
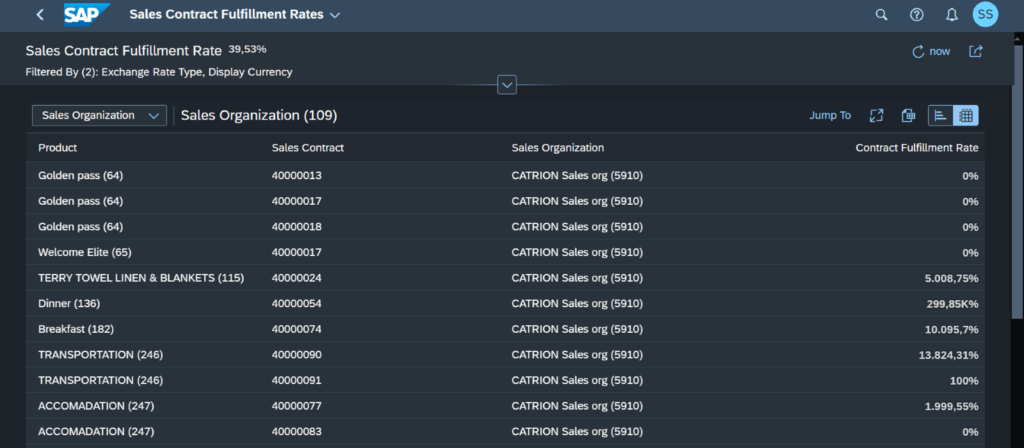
You can list sales contracts with details such as document number, sales organization, target value, fulfilment rate.
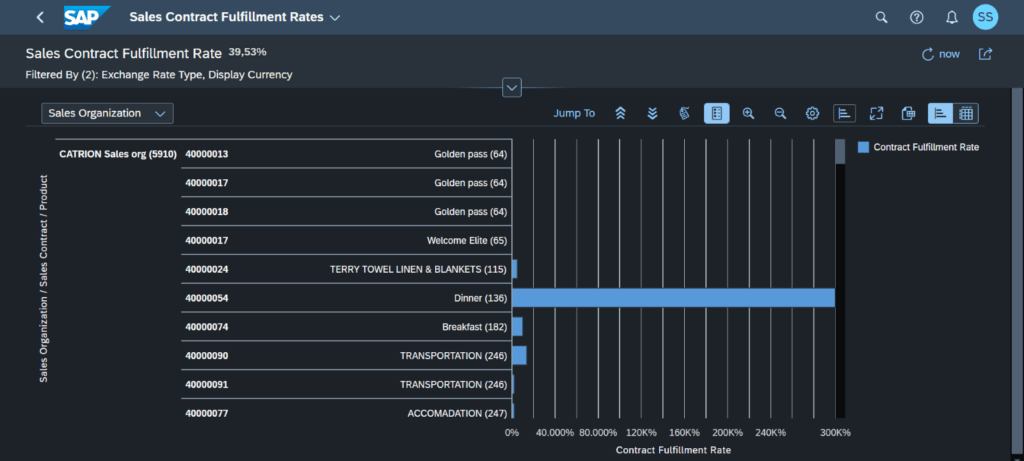
Table View:
5. Incoming Sales order -flexible analysis
You can view the monthly rolling trend for sales as a graphic or a table.
You can drill down to view detailed information for selected sales organizations, products, product groups, sold-to parties, sales document types, and so on.
You can filter the items according to various criteria, such as year, month, sales organization, product group, and sold-to party.
Navigate through the below app:
| APP ID |
DESCRIPTION |
| F1249 |
Incoming sales Orders – flexible analysis |
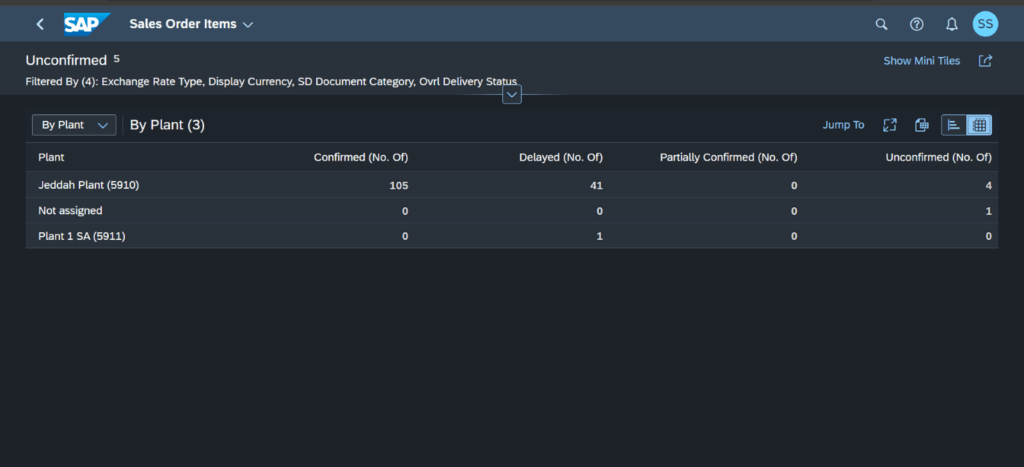
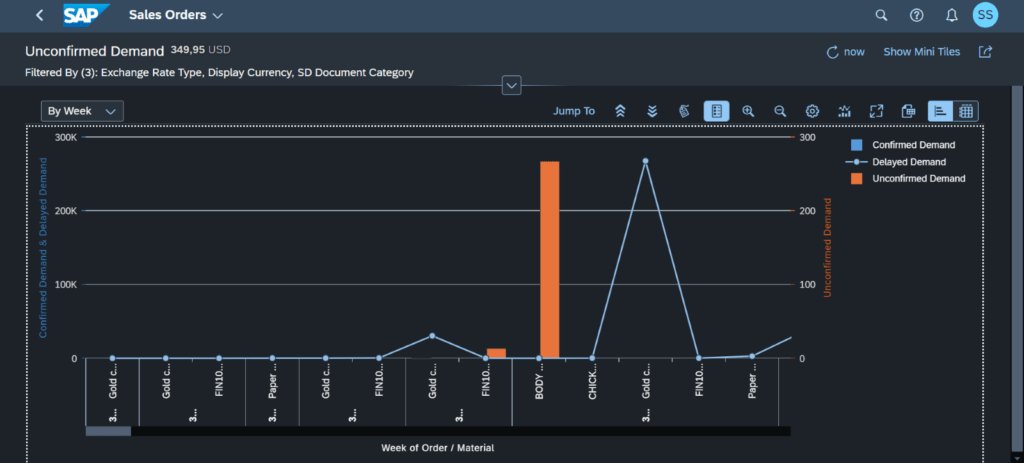
6. Analyze confirmation of sales order
With this app, you can identify bottlenecks that hinder you in fulfilling your customer’s requirements by not delivering their goods by the requested delivery date.
Filter according to various criteria, such as week or year, sold-to party, product, plant, delivery status, sales document type, and so on.
Drill down to view detailed information on specific sales organizations, products, sold-to parties, bill-to parties, and so on.
You can navigate through the below app:
| APP ID |
DESCRIPTION |
| F2458 |
Analyze confirmation of sales order/sales order demand fulfillment |
If you filter out product wise and a particular product has a high number of unconfirmed quantities then you can use Sales Order Fulfillment – Analyze and Resolve Issues to resolve issues, such as unconfirmed quantities, and delivery and credit blocks.
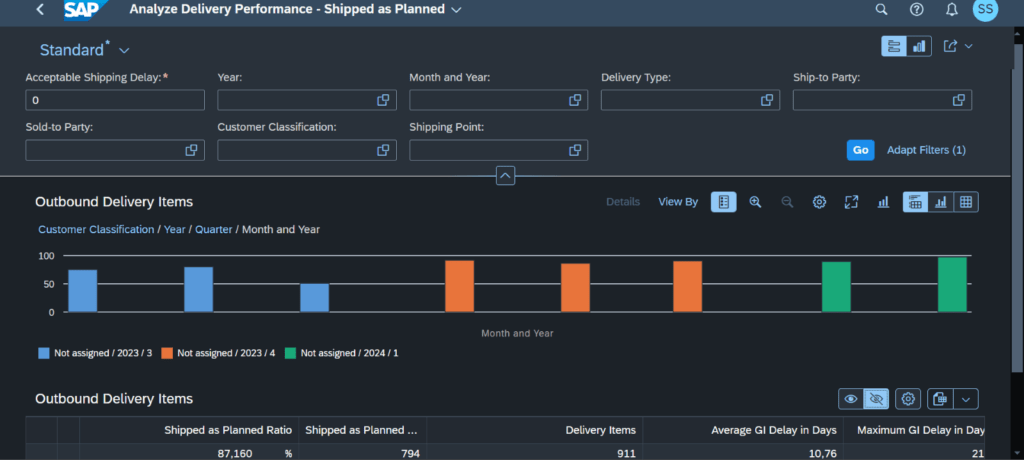
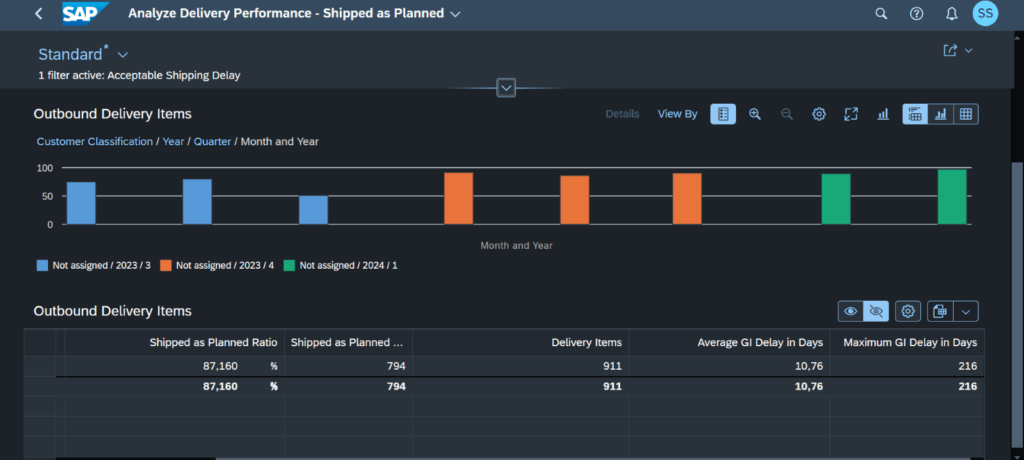
7. Delivery performance
This app allows you to monitor the current delivery performance within your organization, and you can keep track of customer satisfaction and retention.
If delivery performance is below what you expect it to be, you can drill down to individual outbound deliveries that were processed with delay and navigate to the related sales orders for detailed information. You can use this information to help to resolve the issues that caused the delay.
| APP ID |
DESCRIPTION |
| F2878A |
Analyze Delivery performance -shipped vs planned |
View your delivery performance results in various chart forms, for example, column chart, bar chart, and so on, and drill down on further dimensions, such as customer, product group, or plant, using the chart filters.
It can be viewed both graphically and in tabular view.
8. Customer Returns -flexible analysis
With this app, you can analyze the monthly rolling trend of your customer returns based on flexible combinations of dimensions.
Customer return related KPI are:
- Customer returns->contains the Net amount of customer return items that are relevant for billing or delivery.
- Return Item Quantity-> Quantity of customer return items that are relevant for delivery or billing.
- No. of return items-> Number of customer return items that are relevant for delivery or billing.
| APP ID |
DESCRIPTION |
|
W0139 |
Customer Returns |
9. Customer Return Rate
Return Management is a process, when the received goods are broken or not satisfied by the customer, return business would happen. The actions are taken accordingly in time for the damaged products by the sales manager or return clerk.
With the Customer Return Rate app, you can analyze the return rate for products that you are responsible for. The analysis could be a high-level overview of all the products, and it could be also individual customer return.
Navigate through the below app:
| APP ID |
DESCRIPTION |
| F4092 |
Customer Return rate |
10. Sales Volume
10.1 Sales Volume – Flexible analysis
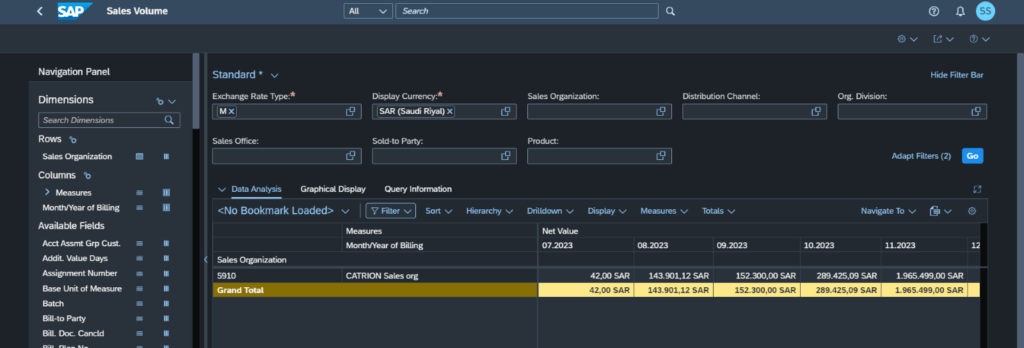
This app helps you to gain an understanding of the monthly sales volume.
Purpose:
- It views the monthly sales volume in table or graphical view
- Drill down to view detailed information for selected sales organizations, sold-to parties, bill-to parties, and so on.
- Filter the items according to various criteria, such as year/month, sales organization, sold-to party, and bill-to party.
Navigate through the below app:
|
APP ID |
DESCRIPTION |
| F1250 |
Sales Volume Flexible analysis |
10.2 Sales Volume – Detailed analysis
With this app, you can drill down into your sales volume from different perspectives.
Sales volume refers to the total invoiced sales achieved during a specified period. This is based on invoice items or debit memo items that have not been cancelled.
It enables sales analysis experts and sales managers to identify the root cause for sales volume increase or reduction.
View and drill down into sales volumes according to different dimensions such as time, sales organization, customer, material, and many more. You can also navigate to related apps: Sales Volume – check open sales.
|
APP ID |
DESCRIPTION |
| F2235 |
Sales Volume Detailed analysis |
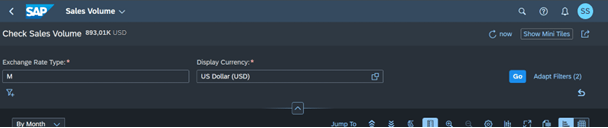
10.3 Sales Volume – Check Open Sales
With this app, you can check your sales volume in comparison with previous months, with the additional insight of open orders and open deliveries for the current month.
This enables you to see how the current month’s sales volume relates to the previous month and shows you where you can still increase your sales volume in the current period.
Purpose:
- Additionally analyze open orders and open deliveries, to identify where you can act in order to increase your sales volume.
- Drill down to view detailed information for selected sales organizations, sold-to parties, product, and so on.
- Navigate directly to the Sales Order Fulfillment app to either resolve the blocks or issues.
|
APP ID |
DESCRIPTION |
| F2270 |
Sales Volume-check open sales |
You can view the graph using different charts such as bar graph, column graph, pie chart and so on.
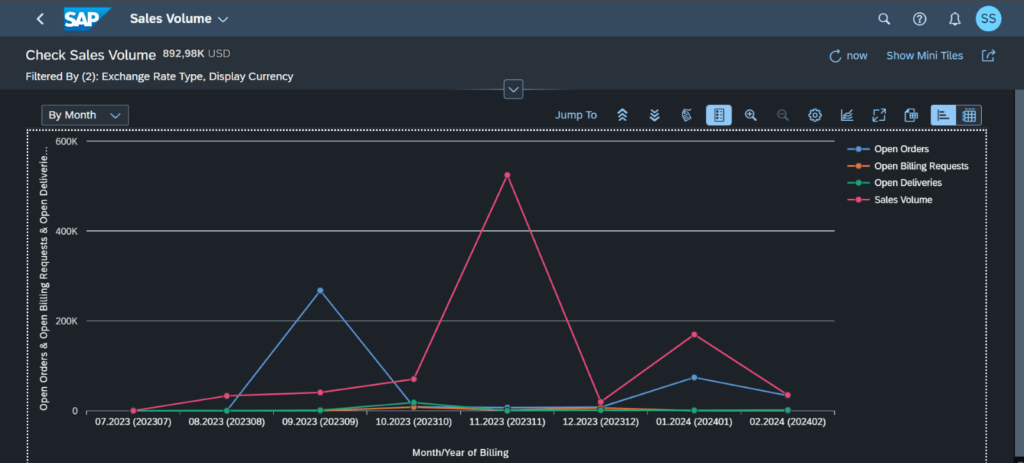
Navigate to related apps via the mini tiles at the top of the screen
Mini Tiles: Sales volume – profit margin, Sales Volume -credit memo
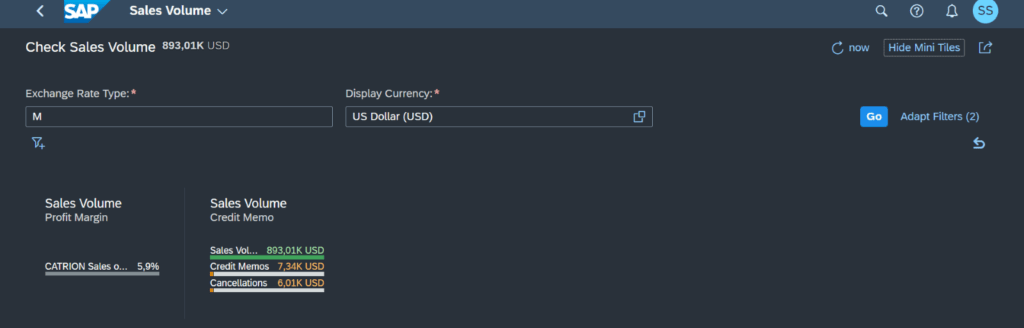
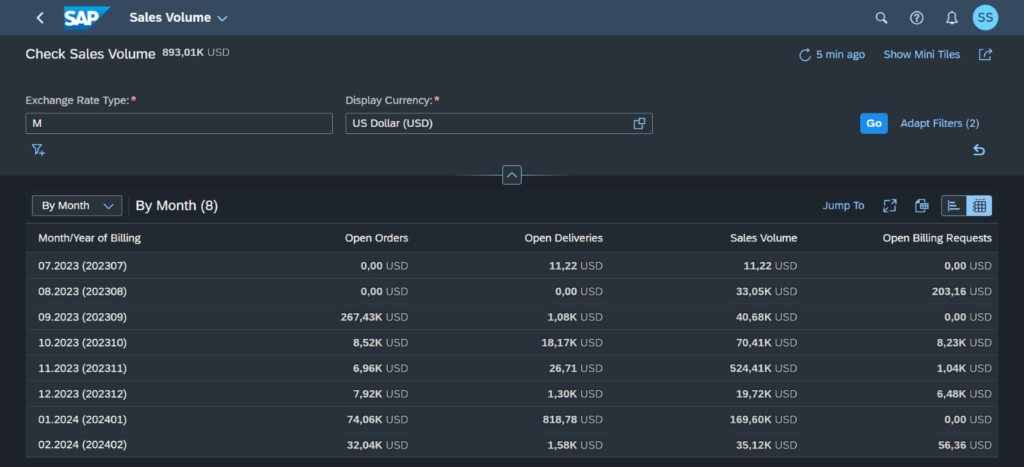
Table View:
All the Sales volume details for open deliveries, open sales order for month/year can be view in tabular column and these details can also be exported in excel sheet.
10.4 Sales Volume – Profit Margin
This app Indicates the difference between sales volume and costs.
We can gain insights into the number of credit memos resulting from returns and complaints, and cancellations, that is, invoices that have been cancelled due to internal errors in your company. From here, you can investigate the reasons for returns and complaints.
|
APP ID |
DESCRIPTION |
| F2271 |
Sales Volume-Profit Margin |
This app helps to View the monthly sales volume and profit margin amount as a graphic or a table.
Graphical View:
You can filter the items according to various criteria, such as year/month, sales organization, sold-to party, sales document.
You can also Navigate to related apps via the mini tiles at the top of the screen
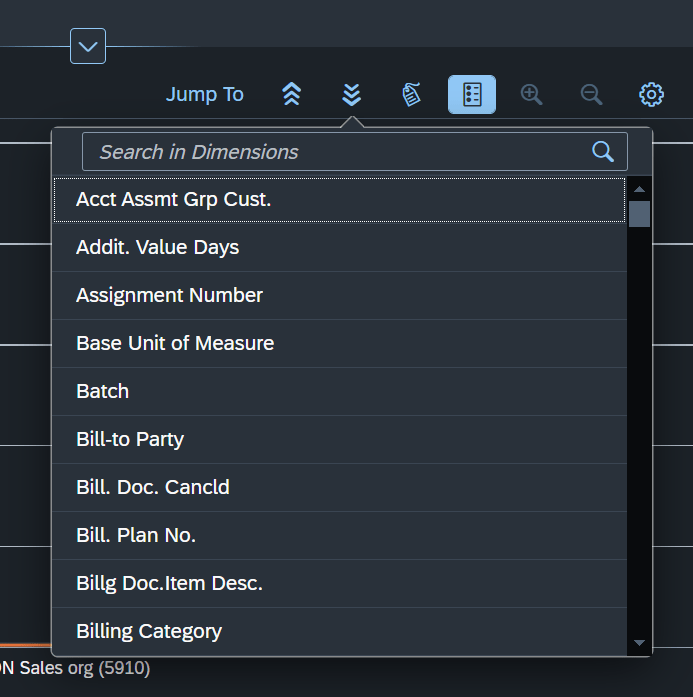
X axis represents the sales volume and profit margins while the Y axis shows the month/year of billing and you can click drill down for various dimensions such as material, sold to party, customer, billing category.

You can change the charts types for different graphical view and if you want to export the data, you can click on export to spreadsheet icon.

Table View:

10.5 Sales Volume – Credit Memo
With Sales Volume – Credit Memo, you can gain insights into the number of credit memos resulting from returns, complaints, and cancellations, that are, invoices that have been cancelled due to internal errors in your company.
| APP ID |
DESCRIPTION |
| F5310 |
Sales Volume-Credit memo |
View the monthly sales volume and profit margin amount as a graphic or a table
Graphical view:
- Extend further dimensions via the drilldown. For example, you drill down by product, and discover a particular product has a negative profit margin.
- Navigate directly to the Sales Volume – Check Open Sales analysis(F2270).
- You can click on Show mini tiles to navigate the related apps: Sales volume – check sales Volume and Sales volume -Profit margin


- Drill down to view detailed information for selected sales organizations, sold-to parties, product, and so on
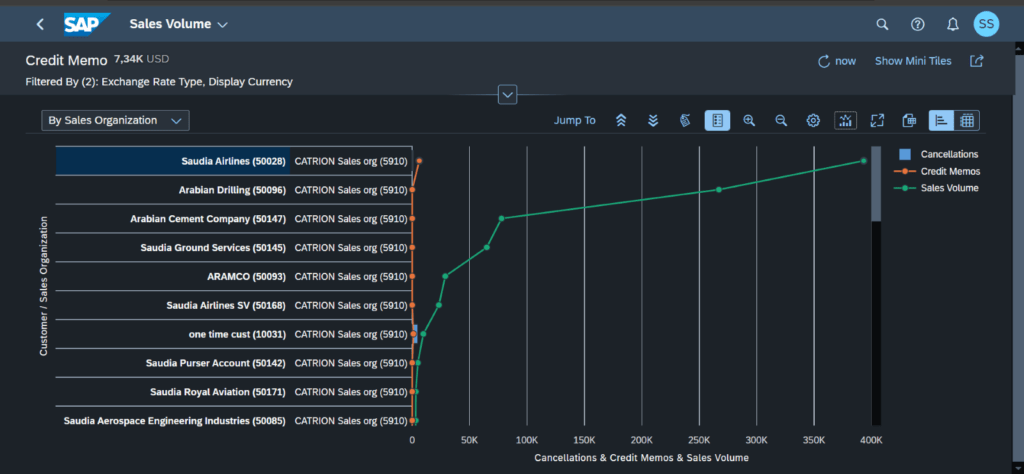
Table View:
You can view the detailed data on sales volume, cancellations, and credit memos in tabular form and it can also be exported through excel sheet.

11. Sales Scheduling agreements – product demand
Have an insight into customer demand on different delivery schedule versions and you can view customer demand for one product based on time frame and look into further details on different dimensions.
Have an insight of open schedule lines for scheduling agreements and drill down to find issue.
It is possible to drill down to the detail view to analyze the demand fluctuation on schedule line level.
It helps you to navigate from high level demand view into detail level view as well as fulfillment overview.
| APP ID |
DESCRIPTION |
| F4508 |
Sales Scheduling agreements – product demand |
In conclusion,
SAP Fiori analytical apps have transformed the way sales professionals approach their roles. These innovative tools empower them to move beyond intuition and anecdotal evidence, instead basing decisions on real-time, data-driven insights. By leveraging the power of SAP Fiori analytical apps, sales teams can:
- Gain a holistic view of sales performance
- Develop targeted customer strategies
- Proactively address fulfilment issues
- Optimize pricing strategies
- Make data-driven decisions for greater sales effectiveness
The result? Sales professionals are transformed into strategic partners, driving increased sales volume, profitability, and ultimately, organizational success.
Ready to Harness the Power of Data-Driven Sales?
If you’re looking to implement SAP Fiori analytical apps within your organization and unlock the potential for transformative sales performance, KaarTech is here to help. Our team of experts possesses the knowledge and experience to guide you through every step of the process.
Contact KaarTech today for a free consultation and discover how SAP Fiori analytical apps can empower your sales team to achieve new heights of success.
