
Dynamic Reporting in SAP Analytics Cloud: Automating Actuals, Forecast, and Plan Based on Cutoff Date
Still spending hours updating SAC Reports every month?
Do you spend hours every month manually updating SAP Analytics Cloud reports to align Actuals, Forecasts, and Plans with changing cutoff dates? Many finance teams face the same challenge of adjusting reports, verifying data, and fixing version mismatches that slow down decision-making and increase the risk of errors.
Forward-thinking finance leaders are addressing this challenge with automation. According to Gartner, 58 % of finance functions now use AI and automation to enhance reporting and analytics. As organizations move toward real-time planning and continuous forecasting, dynamic reporting in SAP Analytics Cloud is becoming an essential capability.
In this blog, we’ll explore how to create a dynamic reporting in SAP Analytics Cloud that automatically adjusts Actuals, Forecast, and Plan data based on a single cutoff date helping finance teams save time, improve accuracy, and focus on strategic decision-making.
Why Dynamic Reporting in SAP Analytics Cloud Matters
Finance teams constantly manage multiple data versions – Actuals, Forecast, and Plan. When the cutoff month changes, these reports must be manually adjusted to reflect new periods. For example, Actuals must represent completed months, Forecast must include current and upcoming months, and Plan must show next year’s data.
Manually updating each version every month can cause:
- Errors in version mapping
- Inconsistent reporting
- Delays in publishing reports
These challenges become more complex for enterprises with multiple entities, fiscal calendars, and rolling forecasts. The solution lies in building a dynamic reporting model in SAP Analytics Cloud that automates this entire process using cutoff date logic.
The Business Use Case for Dynamic Reporting in SAP Analytics Cloud
The requirement is to create a single report where Actuals, Forecast, and Plan data are displayed dynamically based on the cutoff date defined by the Budget Administrator.

Fig 1: Expected Report Layout
- Actual = Current Year Past Periods
- Forecast = Current Year Future Periods
- Plan = Next Year Periods
This design ensures that every time the cutoff month is updated, SAC automatically recalculates and aligns all reporting periods keeping the data relevant without manual intervention.
Step-by-Step Solution to Implement Dynamic Reporting in SAP Analytics Cloud
Step 1: Create Restricted Measures
Create three restricted measures for Actuals, Forecast, and Plan. The Version dimension values are set manually, while the Date dimension values are fetched from Calculated Input Control and will be controlled through scripting.
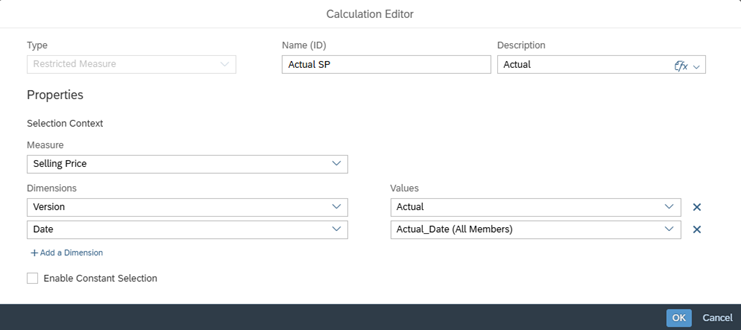
Fig 2: Restricted Measure
Step 2: Configure Input Controls
Create three input controls, one each for Actual, Forecast, and Plan. These will be hidden in the application and will be dynamically updated using scripting logic.
Each input control acts as a filter mechanism that determines which periods of data are displayed for its respective version. Instead of the user manually selecting the time frames every month, these controls are automatically updated through the script in the next step, ensuring the correct set of periods (months) are applied based on the maintained cutoff date.

Fig 3: Calculated Input Control
Step 3: Apply Scripting Logic
In the application’s on Initialization function, use the following script to retrieve the cutoff month from the Version dimension, and then assign the relevant periods to Actual, Forecast, and Plan input controls dynamically.
Application.showBusyIndicator(“Loading, Please Wait…”);
// Getting the Cutoff Month From Version Dimension
var version = RevenuePlanning.getMember(“Version”,”public.Forecast”); //RevenuePlanning is the Planning Model
var calmonth = version.properties.CutoffDate; // Output = YYYYMM
var cutoffmonth = calmonth.slice(4,6); // Output = MM
var CYear = calmonth.slice(0,4); // Output = YYYY (Current Year)
var BYear = ConvertUtils.numberToString(ConvertUtils.stringToInteger(CYear) + 1); // Output = YYYY + 1 (Next Year)
var Month = [“01”,”02″,”03″,”04″,”05″,”06″,”07″,”08″,”09″,”10″,”11″,”12″];
// Creating few Empty arrays for Utils and store the right set of periods
var Dy_Actual = ArrayUtils.create(Type.string);
var Dy_Forecast = ArrayUtils.create(Type.string);
var Dy_Plan = ArrayUtils.create(Type.string);
// Loop to push the right Priods to the Empty Arrays
for(var i =0;i<Month.length;i++)
{
if(Month[i]<cutoffmonth)
{
Dy_Actual.push(“[Date].[YM].&[“ +CYear +Month[i]+“]”);
Dy_Plan.push(“[Date].[YM].&[“ +BYear +Month[i]+“]”);
}
if(Month[i]>=cutoffmonth)
{
Dy_Forecast.push(“[Date].[YM].&[“ +CYear +Month[i]+“]”);
Dy_Plan.push(“[Date].[YM].&[” +BYear +Month[i]+“]”);
}
}
// Setting the Array of Periods to the Input Control using SetParameter Funtion
Actual_Date.getInputControlDataSource().setSelectedMembers(Dy_Actual);
Forecast_Date.getInputControlDataSource().setSelectedMembers(Dy_Forecast);
Plan_Date.getInputControlDataSource().setSelectedMembers(Dy_Plan);
Application.hideBusyIndicator();
Note: When pushing the periods into arrays, ensure that the hierarchy in the input control matches the hierarchy used in the script. In this example, the hierarchy is Year and Month, hence the prefix [Date].[YM].&[YYYYMM] is applied.
Step 4: Test with Cutoff Dates
When the cutoff date is July 2024, Actuals will be assigned to periods before July, Forecast will be for July onward, and Plan will cover the next year’s periods.
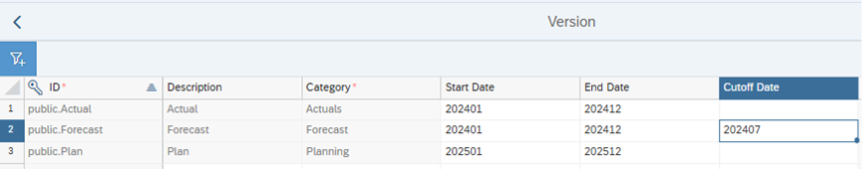
Fig 4: Version Dimension
Video 1: Expected Output
When the cutoff date is October 2024, Actuals include periods up to September, Forecast includes October to December, and Plan covers the next year.
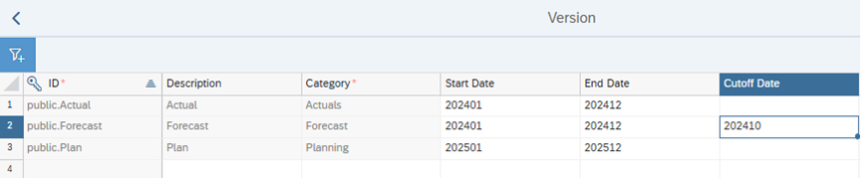
Fig 5: Version Dimension
Video 2: Expected Output
Real-World Example – Budget Planning Automation
Consider a multinational company performing monthly rolling forecasts. The Budget Administrator updates only one field – the cutoff month in the Version dimension.
Without any further manual effort:
- Actuals auto-adjust to cover past months.
- Forecast dynamically realigns with current and future months.
- Plan automatically refreshes for the upcoming fiscal year.
This dynamic behavior ensures that executives always view the most accurate and current data in SAC reports without needing to manually change dimensions or filters each month.
Example Scenario:
When the administrator sets the cutoff date to “2024-07,” the dashboard instantly updates:
- Actual: January–June 2024
- Forecast: July–December 2024
- Plan: January–December 2025
This automation has proven to reduce report maintenance time by over 60% in several organizations, making it a vital enhancement for finance teams.
Building the Future of Financial Reporting
Dynamic reporting in SAP Analytics Cloud transforms the way organizations manage financial planning and performance reporting. By linking Actuals, Forecasts, and Plans to a single cutoff date, finance teams can achieve real-time accuracy, greater efficiency, and better control.
If your goal is to modernize financial planning and eliminate manual maintenance, SAP Analytics Cloud dynamic reporting is the next step forward.
KaarTech helps enterprises implement smart, automated SAP Analytics Cloud solutions that enhance forecasting, improve data accuracy, and accelerate business decision-making.
Talk to our SAP Analytics Cloud experts today to get started.
FAQ’s
1. What is SAP Analytics Cloud dynamic reporting?
Dynamic reporting in SAP Analytics Cloud automatically updates Actuals, Forecasts, and Plans based on a cutoff date, keeping reports current and accurate.
2. How do you automate reports in SAP Analytics Cloud?
Reports can be automated by using scripting and cutoff date logic, which refreshes financial data and adjusts versions without manual updates.
3. What are the benefits of dynamic reporting in SAP Analytics Cloud?
Automation in SAC reduces manual effort, improves reporting accuracy, and helps finance teams make faster and more reliable business decisions.
4. Can SAP Analytics Cloud handle multiple fiscal years or entities?
SAP Analytics Cloud supports multi-entity and multi-year financial reporting, making it suitable for global enterprises with complex structures.


