
How SAP Enterprise Analytics Transformed Business Decisions
Most people start their day by glancing at a finance or investment dashboard — just a quick check to see where things stand, how money is moving, and whether everything’s on track. It’s clear, simple, and gives an instant sense of control.
Running a business often feels very different. Reports take hours to prepare; data are available in different systems, and by the time the numbers reach decision-makers, they’ve already lost their relevance.
That’s where SAP Enterprise Analytics steps in. It brings all business data together in one place, giving teams a single, real-time view that makes understanding performance effortless as checking a dashboard.
Here’s how one organization made that leap, turning messy spreadsheets and delayed reports into a single, real-time dashboard that tells the story behind every number. Curious how we did it? Read on to see how.
Client Overview
The company is a well-established Middle Eastern conglomerate with over five decades of history. Having operations in food manufacturing, consumer goods distribution, agriculture, and recycling, they have built a strong reputation of quality, creativity, and dependability. With far-reaching operations, thousands of employees, and a vibrant supply chain, the business continuously pushes itself to be more efficient and responsive.
The Challenge
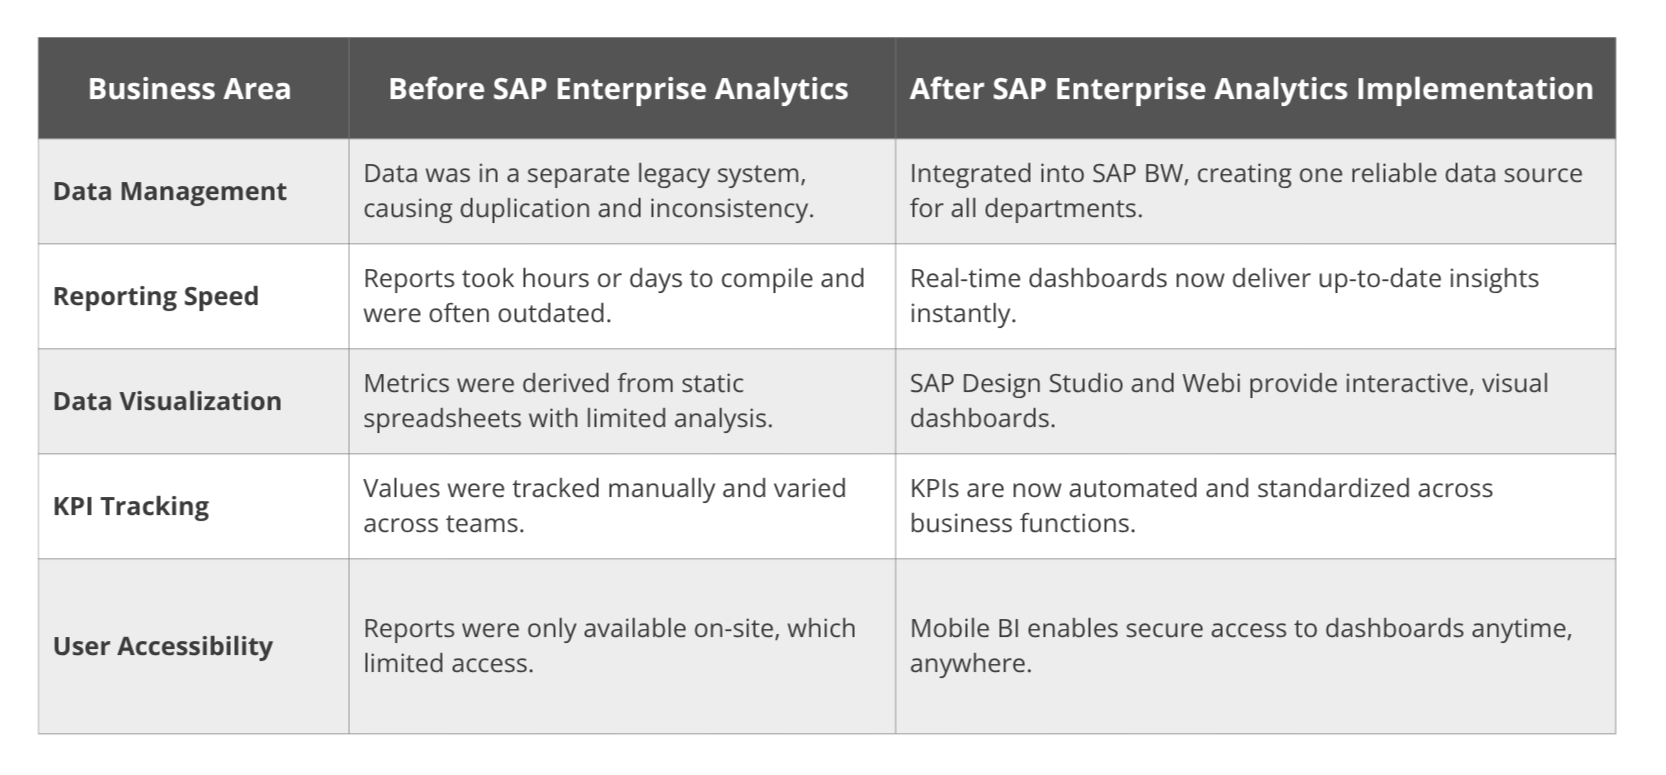
As the client’s business expanded into various products and markets globally, its data ecosystem became increasingly complex. Information was trapped in the old legacy system that couldn’t communicate with each other, making teams navigate through siloed and outdated data. Because of which the client faced several challenges:
- No unified data view: Finance, sales, and procurement data existed in silos, preventing a single, consistent source of truth.
- Slow reporting cycle: Manual report generation took hours, offering limited insights from static spreadsheets.
- Poor user experience: Non-interactive reports made it hard for business users to explore or analyze data independently.
- Inconsistent KPI tracking: Departments used different metrics and methods, leading to misaligned performance insights.
- Lack of predictive visibility: Without alert-based analytics, issues were identified only after impacting operations.
SAP Enterprise Analytics: The Solution
To manage the client’s growing analytics challenges, KaarTech started by rethinking how information moved across the organization. The goal was to build a unified analytics foundation that could bring together scattered data, automate manual reporting, and provide leaders with real-time visibility into business performance.
The engagement began with an in-depth analysis of existing systems, which involved understanding how data was being recorded, processed, and stored across procurement, sales, finance, and warehouse operations. From there, KaarTech’s team mapped every key data flow and designed an integration framework that ensured data from all corners of the business could be cleaned, connected, and synchronized into one reliable model.
At the core of this framework was SAP Enterprise Analytics, which is a suite of tools designed to turn fragmented data into actionable insights, helping teams move from information overload to true business intelligence.
In simple terms, SAP Enterprise Analytics brings everything together. It combines tools like SAP Business Warehouse (BW) to organize and consolidate data, SAP BusinessObjects (BO) and SAP Design Studio to turn that data into clear, visual dashboards, and SAP Mobile BI to make insights accessible from anywhere.
KaarTech started by setting up SAP BW 7.x as the core data backbone, pulling information from different business systems into one structured place. On top of that, SAP BusinessObjects 4.1 gave teams the ability to build their own dashboards using Web Intelligence (Webi).
Using SAP Design Studio, KaarTech then built simple, role-based analytics applications for teams in finance, sales, and inventory. Each one was tailored to help them track performance, spot trends, and act faster.
To make things even more seamless, Mobile BI extended all this to smartphones and tablets, which allowed management to check numbers, monitor KPIs, or review dashboards wherever they were in meetings, at client sites or anywhere.
In the end, this setup gave the organization a strong, flexible analytics foundation, one that made data easy to trust, easy to use, and ready for whatever comes next.
The Result
After rolling out the SAP Enterprise Analytics framework, the organization’s entire approach to insights began to shift.
By integrating SAP Business Warehouse, SAP BusinessObjects, and Design Studio, information started flowing effortlessly from daily operations to dashboards. Executives could monitor key metrics briefly, while teams on the ground will be able to dig deeper and act quickly when something is off.

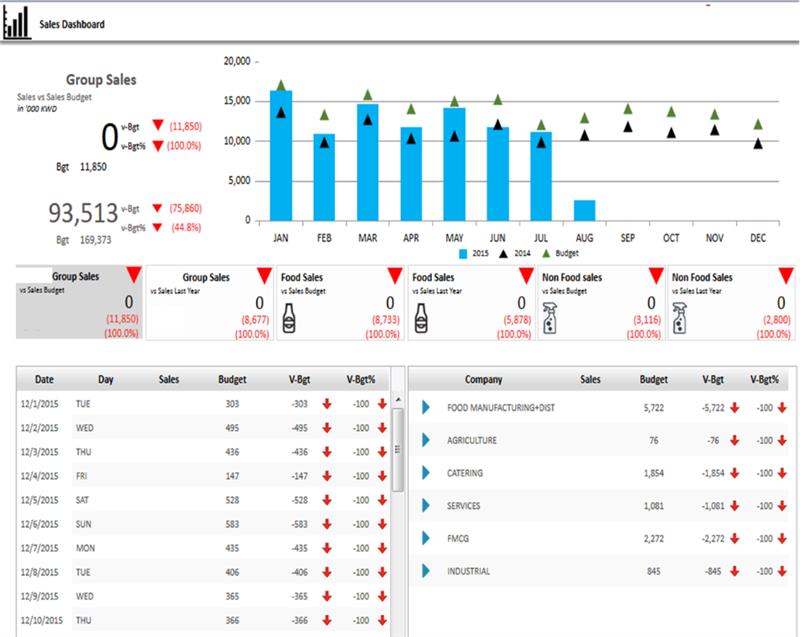
From complex spreadsheets and disconnected reports to a single, interactive dashboard, this is the result we delivered. What once took hours of manual effort and cross-checking across departments now appears instantly in one unified view. Sales, finance, and operations teams can finally see the same data at the same time, with complete clarity and confidence.
This cohesive analytics ecosystem now supports data clarity, consistency, and faster strategic alignment across all business units.
Client Quote
The SAP Enterprise Analytics implementation was truly a team story. The client noticed that spirit of teamwork and appreciated how seamlessly the project came together.
Here is a customer testimonial from the Kuwaiti Conglomerate:
“The team has worked exceptionally hard over the past month to deliver this project within the planned timeline. I’m truly pleased with the outcome and appreciate the collaboration, commitment, and teamwork shown by everyone involved in bringing this implementation to life.”
Key Takeaways
This project reminded us that building an analytics foundation isn’t just about software but more about helping people reconnect with their data and feel confident using it again. Here’s what truly made the difference:
- One truth: When everyone looks at the same reliable data, everything changes. The focus shifts from arguing over numbers to having real conversations.
- One network: By linking sales, finance, and procurement, we brought different teams to the same page. Information flow was faster, collaboration was easier, and decisions didn’t have to wait for the next report.
- Simple wins: When dashboards are easy to use and are visually clear, people don’t feel burdened by data, rather they feel enabled by it to take informed decisions.
- Clear structure: Standardized models and defined KPIs ensure every report is taken from the same trusted data, bringing consistency and confidence to decision-making.
- Built to grow: A flexible, modular architecture setup that can easily adapt to new data models and business requirements, which can ensure long-term scalability.
Call to Action
Every business has useful data that is just waiting to be transformed into knowledge. KaarTech can assist if your company wants to connect systems, streamline filing, and make data-driven decisions more quickly. Our team’s extensive knowledge of enterprise transformation and SAP Enterprise Analytics enables you to build the foundation for more intelligent expansion.
Connect with KaarTech today to begin your journey toward real-time intelligence and operational excellence.
FAQ’s
1. What is SAP Enterprise Analytics?
SAP Enterprise Analytics unified platform combining SAP BW, BO, and Mobile BI to centralize data and provide real-time, visual insights for smarter decisions.
2. How does SAP Enterprise Analytics improve decision-making?
By unifying data into one reliable source, it eliminates silos, updates in real time, and helps teams make faster, data-driven decisions.
3. Who benefits the most from SAP Enterprise Analytics?
Business leaders, analysts, and teams in finance, sales, and procurement gain real-time visibility and consistent metrics for confident, quick decisions.
4. How is SAP Enterprise Analytics different from traditional reporting tools?
Unlike static reports, it offers interactive dashboards, automated KPIs, and real-time data for proactive, insight-driven decision-making.


